#MarchMadness2012 In Different College Basketball Bracket, Study Finds Gap in Grad Rate @MarchMadness


Ahead of Thursday’s tipoff of the NCAA men’s basketball tournament, a study has found anew that the gap in the graduation rate between white and black players remains wide.
The annual report, “Keeping Score When It Counts,” by the Institute for Diversity and Ethics in Sports at the University of Central Florida found a 28 percent difference between the graduation rates of white players compared to their black counterparts. The report found a four-point improvement from last year, but according to lead author Richard Lapchick the driving force behind the change was a decrease in the percentage of white players graduating.
Overall, the graduation rate for male basketball student-athletes ticked up slightly to 67 percent from 66 percent in 2011. U.S. Secretary of Education Arne Duncan, a former college basketball player, has pushed the NCAA for years to improve the number of graduating athletes and last year called for the NCAA to ban teams with graduation rates below 40 percent from competing in the championship tournament.
In October, the NCAA responded by requiring all teams to meet a 50 percent graduation rate, with failure to do so for three straight years resulting in a ban from postseason play and potential scholarship and practice restrictions as well.
“Clear incentives change behavior in a radical way,” Duncan said on a call to reporters Wednesday. He praised the NCAA for moving “faster and further” on this issue than many expected.
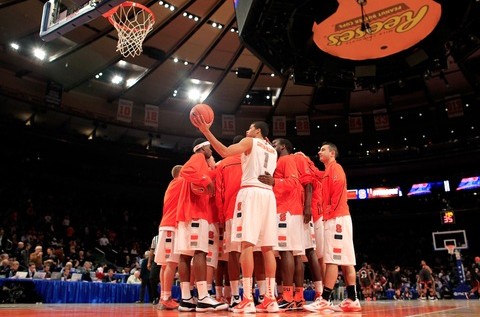
This year, 13 teams in the men’s tournament failed to meet that new standard, including 2011 national champion Connecticut and 2012 tournament No. 1 seed Syracuse.
Once again, women’s college basketball programs beat the men in graduation rates. The report found 92 percent of the women’s teams compared to 39 percent of men’s teams graduate at least 70 percent of their players. Twenty-two women’s teams have a 100 percent graduation rate in this year’s tournament, including the University of Connecticut.
“The women’s teams always give us good news to report each year. It has been clear that student-athletes on women’s basketball teams graduate at a higher rate that student-athletes on men’s basketball teams,” Lapchick said.
“Additionally, the disparity gap between white and African–American student athletes has always been significantly smaller on women’s teams compared to men’s teams. This year’s study reveals that there has been no change in the disparity between graduation rates of white and African–American women student-athletes, which remains 8 percent compared to 28 percent for the men’s teams,” Lapchick said.
012 Men’s Teams in the NCAA Division I Basketball Tournament
This table has graduation rates for any of the men’s teams participating in the March Madness tournament this year. It compares rates for student athletes and for basketball players, including by race. It also features the APR or Academic Performance Rate for those schools — a four-year average of academic performance that rewards student athletes for remaining eligible and continuing education at the same school. Source: The Institute for Diversity and Ethics in Sport
| School | APR | Overall Student-Athlete |
African–American Basketball Student-Athlete |
White Basketball Student-Athlete |
Overall Basketball Student-Athlete |
|---|---|---|---|---|---|
| Harvard University | 991 | 98 | 100 | 100 | |
| South Dakota State University | 964 | 80 | 0 | 67 | 50 |
| University of California, Berkeley | 948 | 79 | 14 | 50 | 33 |
| University of Connecticut | 893 | 81 | 14 | 50 | 25 |
| University of Florida | 964 | 83 | 20 | 100 | 38 |
| New Mexico State University | 906 | 66 | 23 | 100 | 28 |
| Iowa State University | 936 | 79 | 29 | 100 | 45 |
| University of Wisconsin, Madison | 970 | 81 | 29 | 100 | 50 |
| University of Texas at Austin | 1000 | 74 | 33 | 80 | 67 |
| University of Virginia | 940 | 87 | 33 | 100 | 50 |
| Mississippi Valley State University | 884 | 42 | 35 | 35 | |
| Temple University | 954 | 77 | 36 | 0 | 43 |
| Kansas State University | 937 | 78 | 38 | 100 | 50 |
| University of Michigan | 970 | 82 | 38 | 100 | 45 |
| University of Colorado, Boulder | 926 | 74 | 42 | 43 | |
| Colorado State University | 914 | 83 | 43 | 100 | 64 |
| Indiana University, Bloomington | 929 | 77 | 43 | 100 | 47 |
| Purdue University | 954 | 77 | 43 | 67 | 50 |
| Long Beach State University | 950 | 78 | 44 | 50 | 45 |
| Syracuse University | 928 | 86 | 44 | 75 | 54 |
| University of Nevada, Las Vegas | 961 | 72 | 44 | 100 | 67 |
| University of Southern Mississippi | 910 | 81 | 45 | 42 | |
| Baylor University | 972 | 79 | 50 | 56 | |
| Gonzaga University | 985 | 94 | 50 | 83 | 73 |
| Murray State University | 932 | 72 | 50 | 100 | 56 |
| Norfolk State University | 894 | 61 | 50 | 43 | |
| Ohio State University | 952 | 82 | 50 | 100 | 57 |
| Saint Louis University | 925 | 87 | 50 | 100 | 67 |
| University of Louisville | 965 | 81 | 50 | 100 | 56 |
| University of Memphis | 989 | 80 | 50 | 55 | |
| University of New Mexico | 932 | 74 | 50 | 75 | 57 |
| University of South Florida | 937 | 74 | 50 | 100 | 44 |
| University of Cincinnati | 992 | 81 | 53 | 56 | |
| St. Bonaventure University | 894 | 88 | 56 | 67 | 65 |
| Florida State University | 926 | 79 | 57 | 100 | 67 |
| University of Missouri, Columbia | 974 | 81 | 57 | 67 | |
| University of North Carolina, Asheville | 964 | 65 | 57 | 50 | 57 |
| University of Alabama | 973 | 82 | 60 | 67 | |
| University of Kentucky | 974 | 77 | 60 | 100 | 69 |
| University of Montana | 950 | 74 | 60 | 100 | 75 |
| San Diego State University | 938 | 70 | 63 | 100 | 62 |
| Georgetown University | 937 | 94 | 67 | 70 | |
| Lamar University | 934 | 68 | 67 | 0 | 65 |
| Lehigh University | 994 | 86 | 67 | 100 | 85 |
| Michigan State University | 995 | 83 | 67 | 100 | 82 |
| Ohio University | 910 | 82 | 67 | 100 | 79 |
| St. Mary’s College of California | 953 | 94 | 67 | 80 | 82 |
| Iona College | 955 | 83 | 70 | 53 | |
| Virginia Commonwealth University | 949 | 78 | 71 | 67 | |
| West Virginia University | 995 | 80 | 71 | 100 | 83 |
| Marquette University | 980 | 92 | 80 | 100 | 91 |
| University of Kansas | 1000 | 79 | 80 | 100 | 91 |
| Wichita State University | 955 | 85 | 80 | 100 | 92 |
| Loyola University Maryland | 966 | 96 | 83 | 100 | 92 |
| North Carolina State University | 985 | 74 | 83 | 50 | 80 |
| University of Detroit Mercy | 936 | 92 | 86 | 100 | 89 |
| University of North Carolina, Chapel Hill | 985 | 88 | 86 | 100 | 89 |
| Long Island University – Brooklyn Campus | 933 | 83 | 88 | 100 | 91 |
| Xavier University | 980 | 95 | 92 | 100 | 93 |
| Belmont University | 995 | 91 | 100 | 100 | 100 |
| Brigham Young University | 991 | 76 | 100 | 100 | 100 |
| Creighton University | 960 | 96 | 100 | 100 | 100 |
| Davidson College | 995 | 97 | 100 | 100 | 100 |
| Duke University | 990 | 97 | 100 | 100 | 100 |
| University of Notre Dame | 989 | 99 | 100 | 100 | 100 |
| University of Vermont | 980 | 95 | 100 | 100 | 86 |
| Vanderbilt University | 974 | 92 | 100 | 100 | 93 |
| Western Kentucky University | 964 | 80 | 100 | 100 | 100 |


![#RelevantClassics: Larry Johnson’s 4-Point Play [Video]](http://iamnotarapperispit.com/wp-content/uploads/2013/05/026-480x317.jpg)
